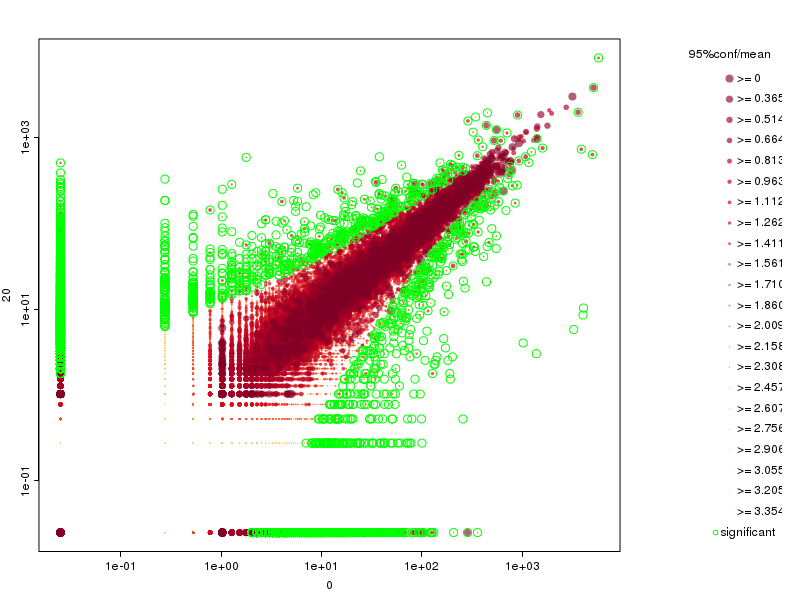
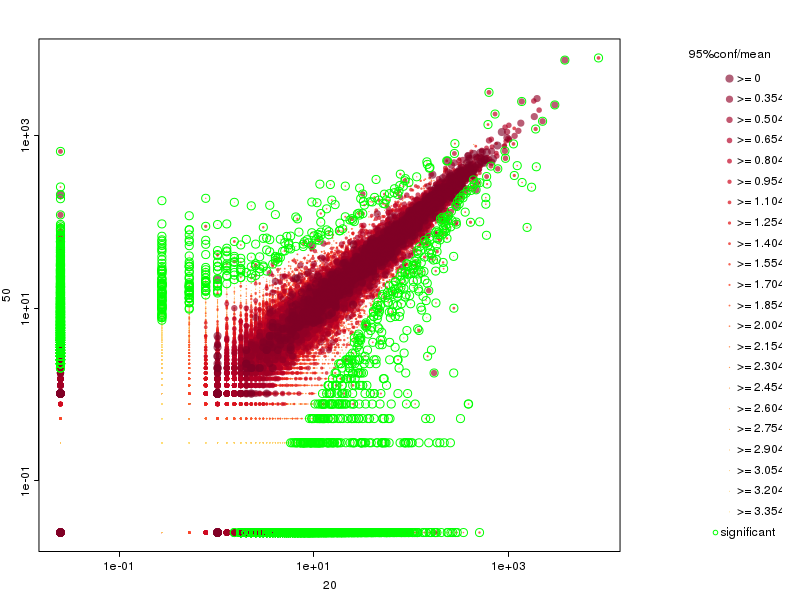
20
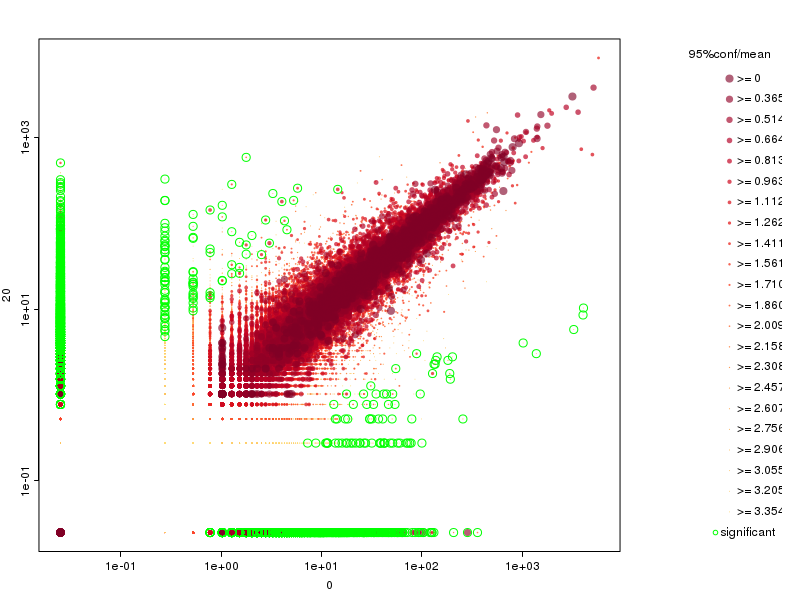
upregulated in 0
upregulated in 20
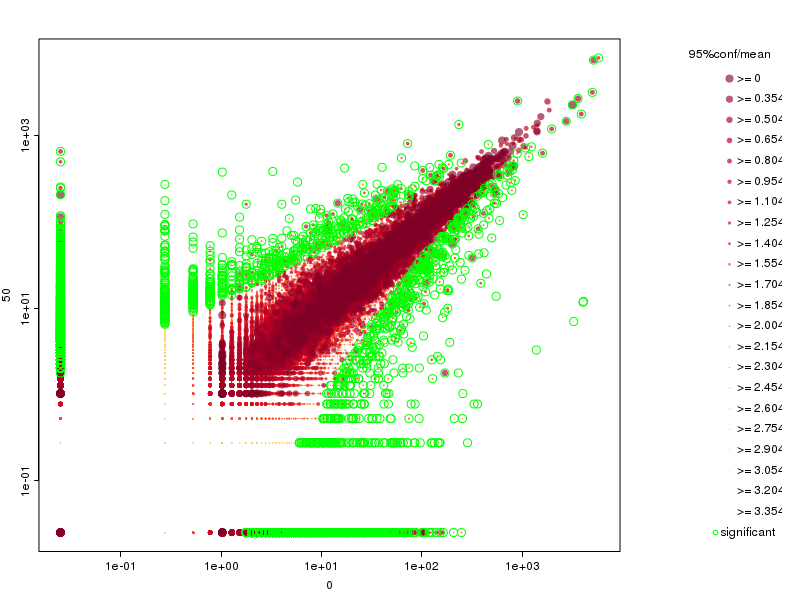
50
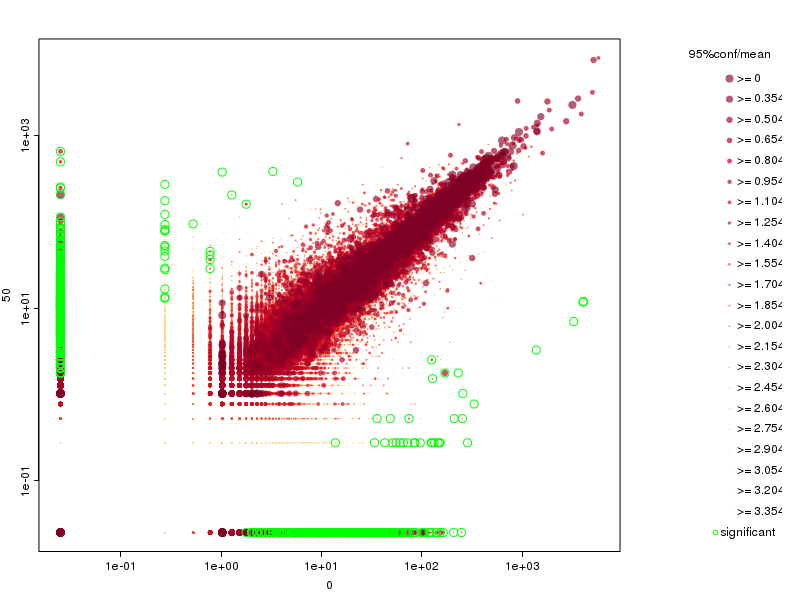
upregulated in 0
upregulated in 50
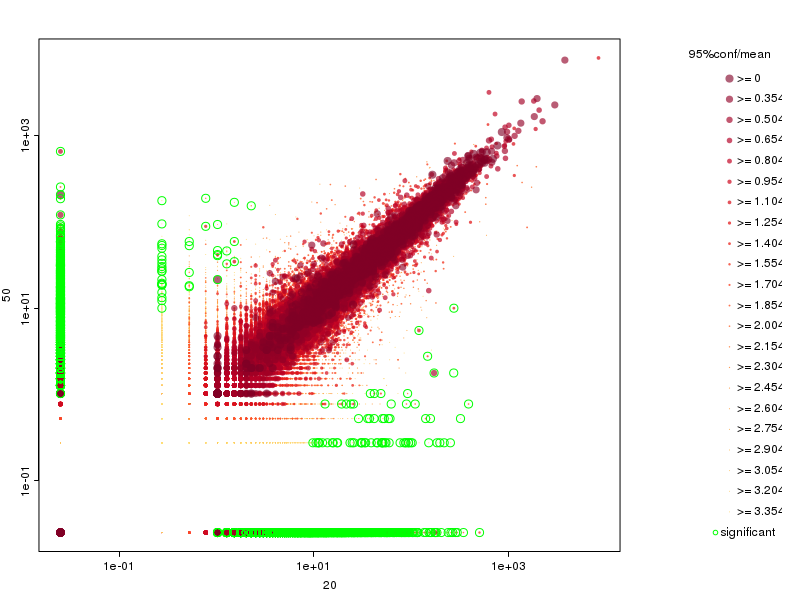
upregulated in 20
upregulated in 50
| 0 | 20 | |
|---|---|---|
20 |
upregulated in 0 upregulated in 20 |
|
50 |
upregulated in 0 upregulated in 50 |
upregulated in 20 upregulated in 50 |
| 0 | 20 | |
|---|---|---|
20 |
upregulated in 0 upregulated in 20 |
|
50 |
upregulated in 0 upregulated in 50 |
upregulated in 20 upregulated in 50 |