Flow chart: RNA-seq -> HISAT2, StringTie, Cuffdiff
graph LR;
A((FASTQ))-->B{PRINSEQ 0.20.4};
B-->C{HISAT2 2.1.0}
C-->D{StringTie 1.3.4}
D-->E(reference guided assembled transcripts)
E-->F{StringTie merge 1.3.4}
A2((FASTQ))-->B2{PRINSEQ 0.20.4};
B2-->C2{HISAT2 2.1.0}
C2-->D2{StringTie 1.3.4}
D2-->E2(reference guided assembled transcripts)
E2-->F
F-->G(merged transcripts)
A-->H{Cuffquant 2.2.1}
A2-->H
G-->H
A-->I{ballgown count}
A2-->I
G-->I
H-->J{Cuffdiff 2.2.1}
I-->K{DESeq2 1.22.2}
G-->L{Trinotate v3.1.1}
I-->M(annotated gene expression table)
L-->M
M-->N(0_result.html)
J-->N
K-->N
O[sample_information.txt]-.->J
O-.->K
P[reference GTF]-.->F
I-->Q{ballgown 2.14.1}
O-.->Q
Q-->N
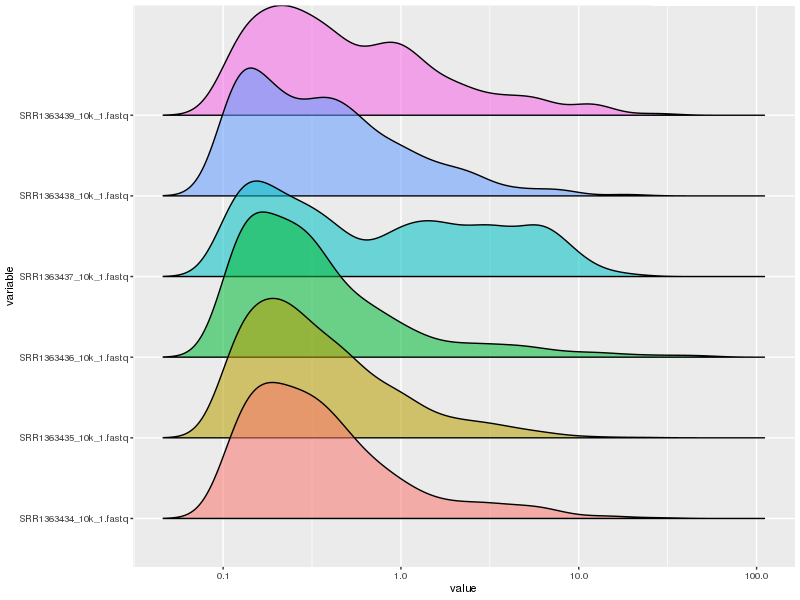
Quality check
Histogram of read counts by transcripts
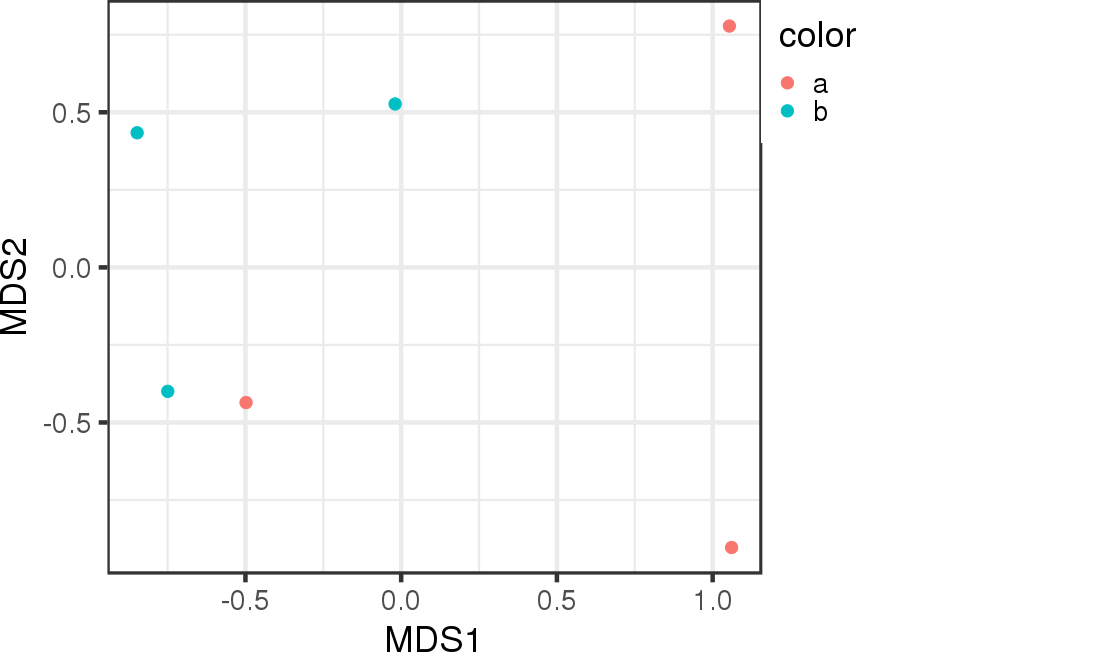
MDS plot
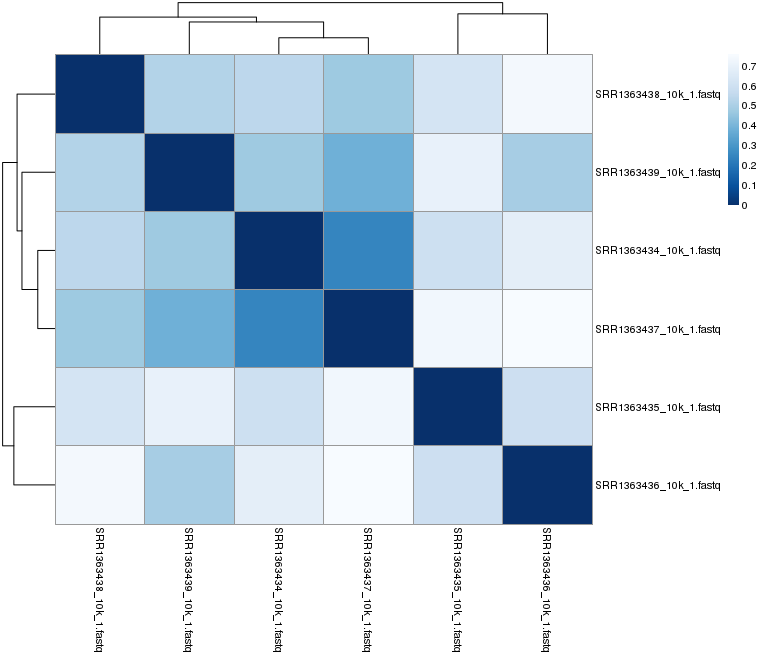
Sample-to-sample Distances
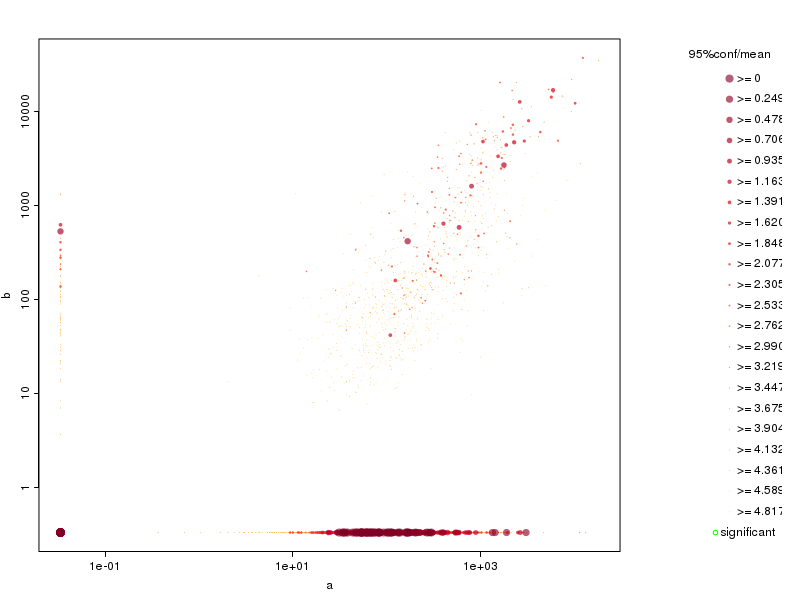
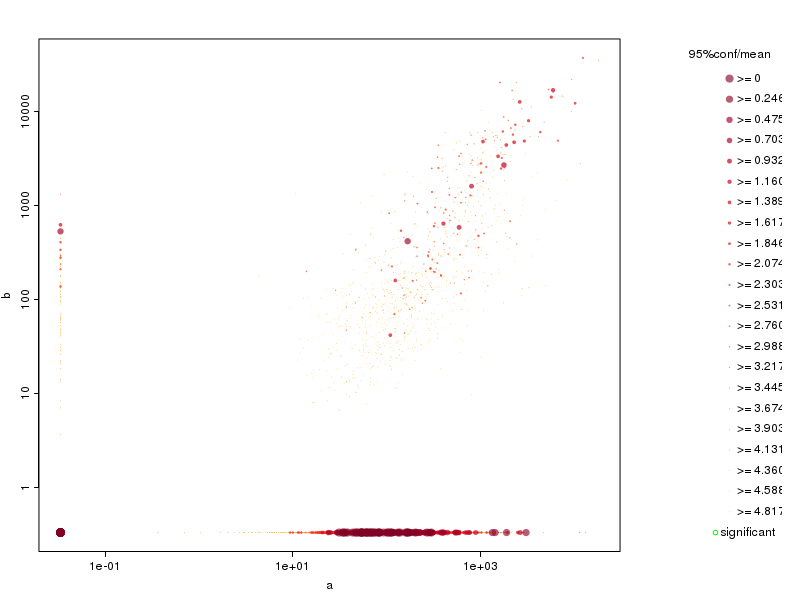
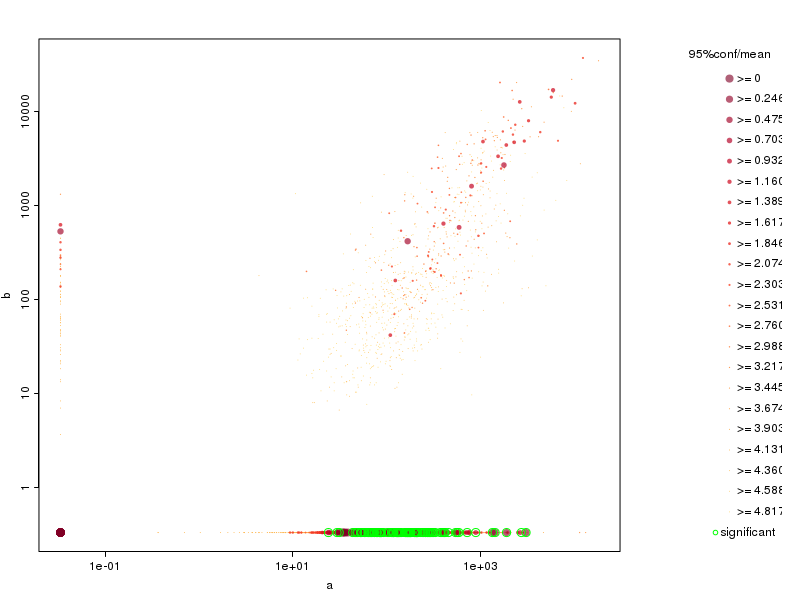
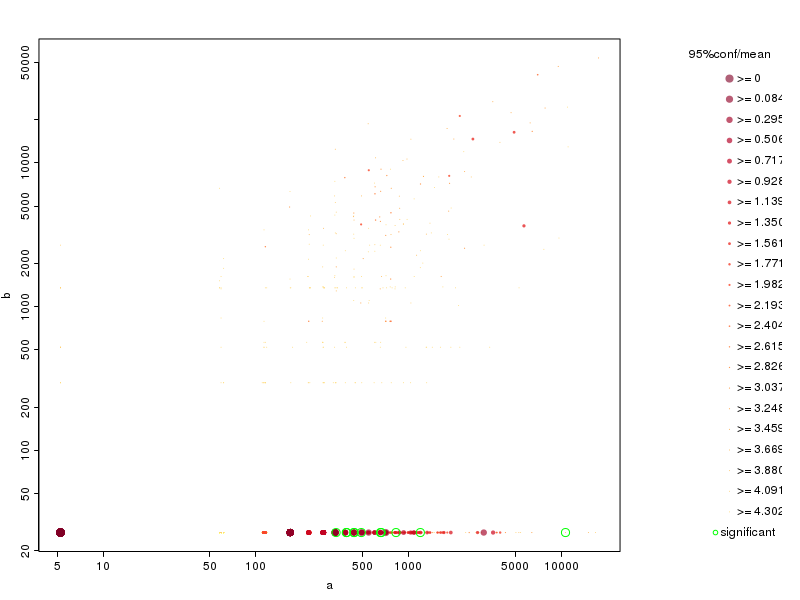
Transcript
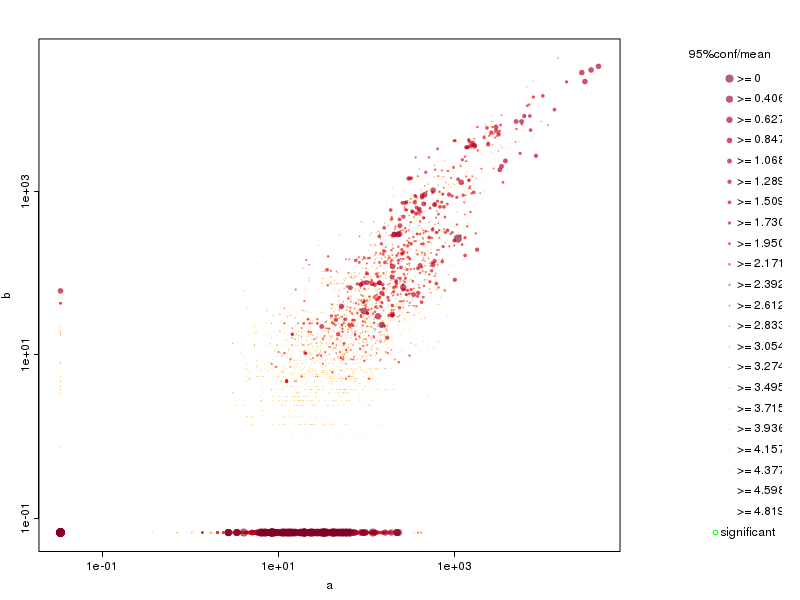
Differential transcript expression analysis by DESeq2 with scatter plot of read counts (counts per million)
Differential transcript expression analysis by edgeR with scatter plot of read counts (counts per million)
Differential transcript expression analysis by ballgown with scatter plot of read counts (counts per million)
Differential transcript expression analysis by Cuffdiff with scatter plot of read counts (counts per million)
Gene
Differential gene expression analysis by DESeq2 with scatter plot of read counts (counts per million)
Differential gene expression analysis by edgeR with scatter plot of read counts (counts per million)
Differential gene expression analysis by ballgown with scatter plot of read counts (counts per million)
Differential gene expression analysis by Cuffdiff with scatter plot of read counts (counts per million)
GO
Differential go expression analysis by DESeq2 with scatter plot of read counts (counts per million)
Differential GO expression analysis by edgeR with scatter plot of read counts (counts per million)
Data download
Stringtie predicted genes
stringtie.merge.gtf
Expression table
Transcript expression table
Gene expression table
GO table
Mapping data
BAM files