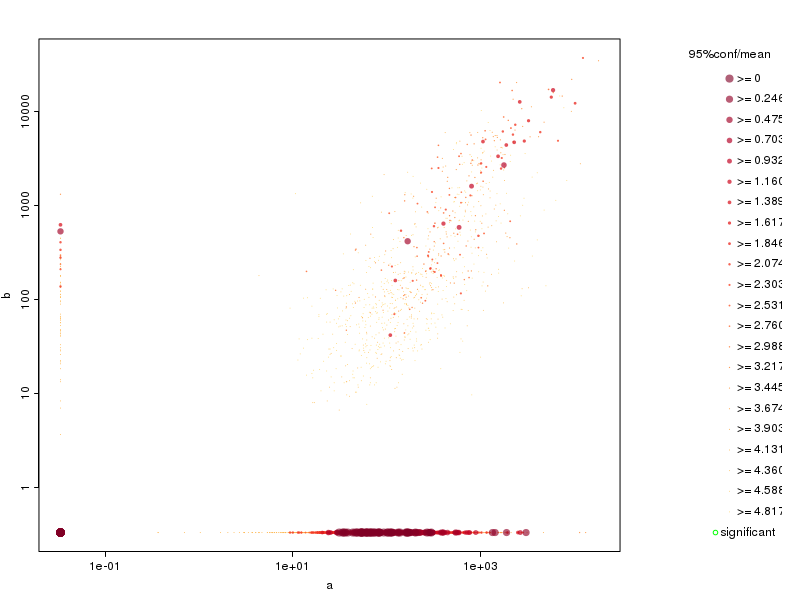
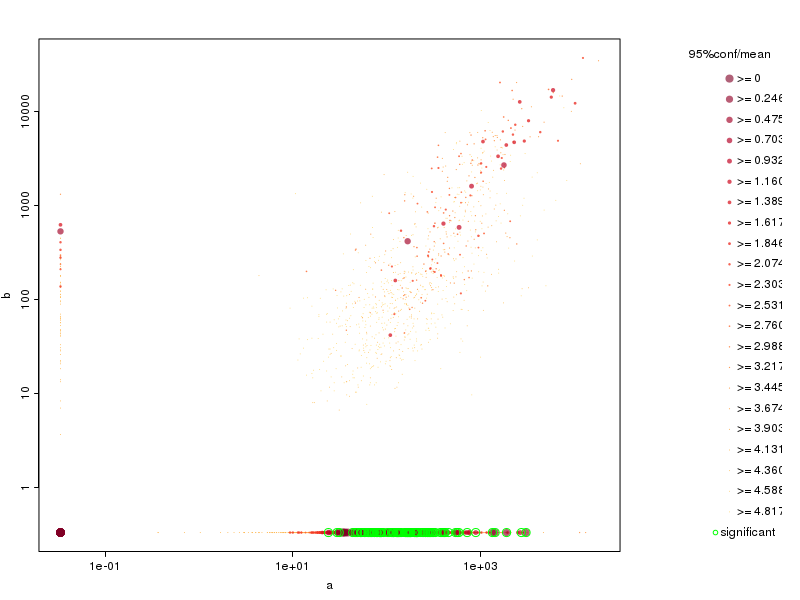
b
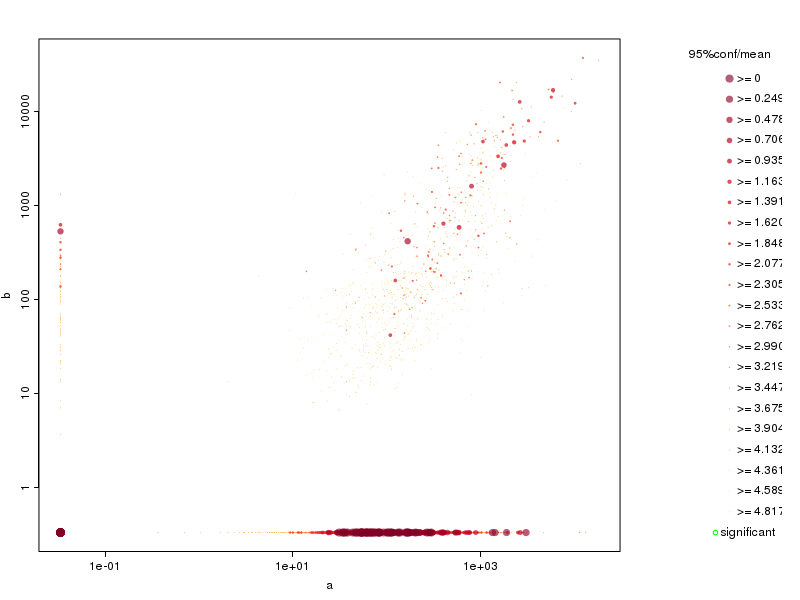
upregulated transcripts in a
upregulated transcripts in b
| a | |
|---|---|
b |
upregulated transcripts in a upregulated transcripts in b |
| a | |
|---|---|
b |

upregulated transcripts in a upregulated transcripts in b |
| a | |
|---|---|
b |

upregulated transcripts in a upregulated transcripts in b |
| a | |
|---|---|
b |

upregulated transcripts in a upregulated transcripts in b |
| a | |
|---|---|
b |
upregulated genes in a upregulated genes in b |
| a | |
|---|---|
b |

upregulated genes in a upregulated genes in b |
| a | |
|---|---|
b |
upregulated genes in a upregulated genes in b |
| a | |
|---|---|
b |

upregulated genes in a upregulated genes in b |