Flow chart: RNA-seq -> Trinity, kallisto, sleuth
graph LR;
A((FASTQ))-->C{Trinity v2.8.5};
A2((FASTQ))-->C;
C-->D(assembled contigs: FASTA);
D-->E{kallisto 0.46.0};
A-->E
A2-->E
E-->F{DESeq2 1.22.2};
E-->G{sleuth 0.30.0};
D-->H{Trinotate v3.1.1}
E-->I(annotated gene expression table)
H-->I
F-->J(0_result.html)
G-->J
I-->J
K[sample_information.txt]-.->F
K-.->G
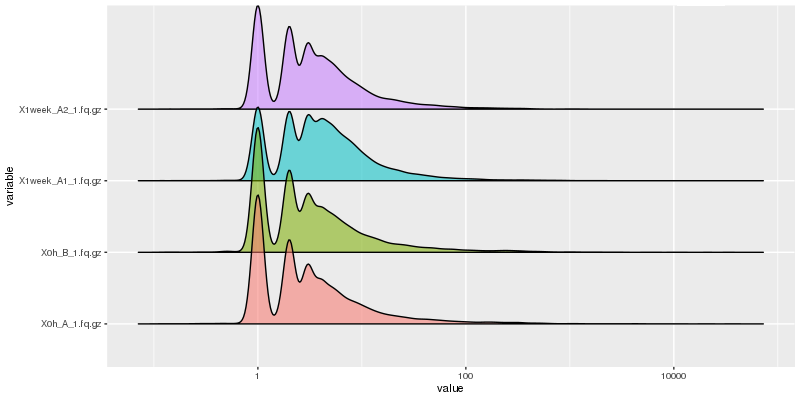
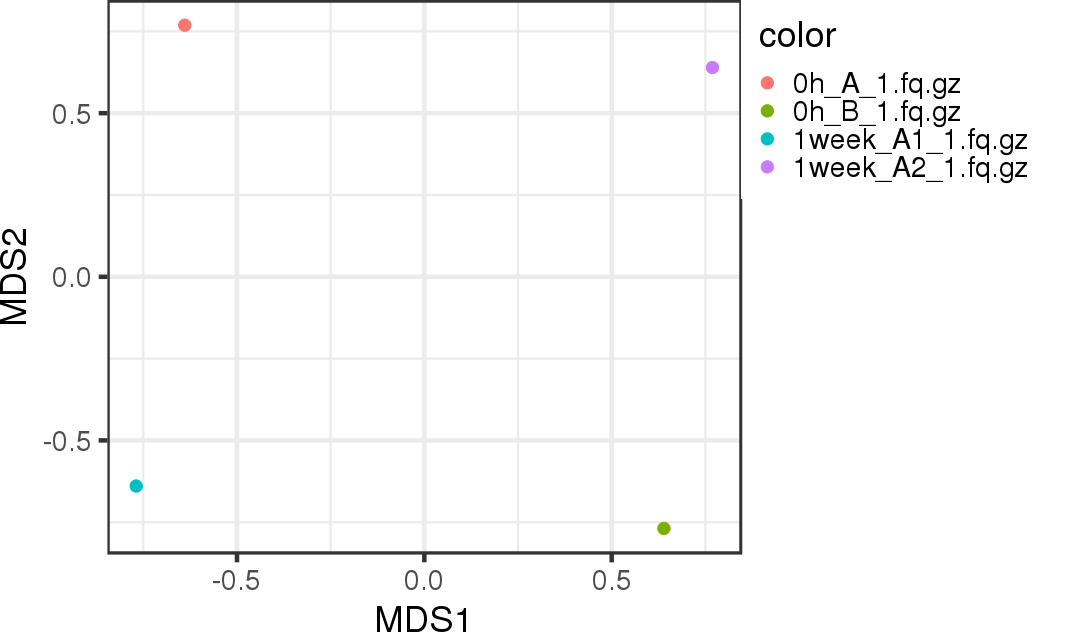
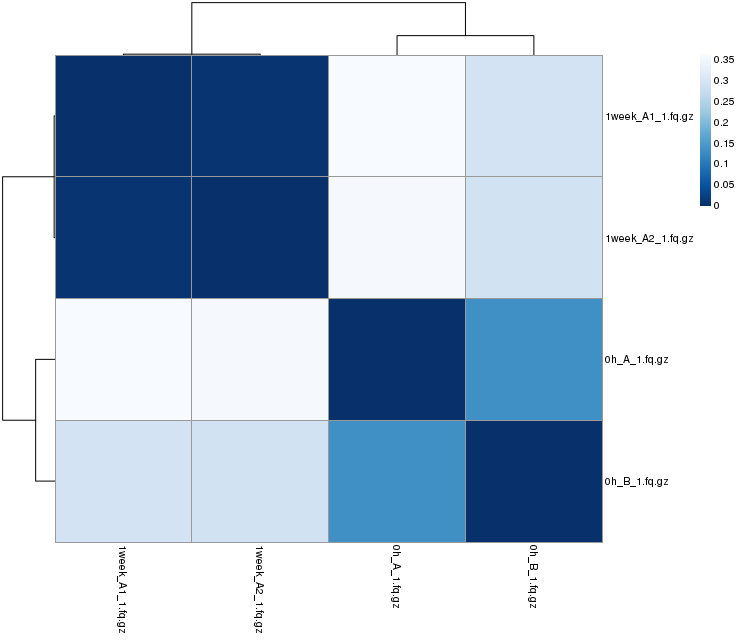
Quality check
Histogram of read counts by transcripts
MDS plot
Sample-to-sample Distances
Transcript
Differential transcript expression analysis by DESeq2 with scatter plot of read counts (counts per million)
Differential transcript expression analysis by edgeR with scatter plot of read counts (counts per million)
Differential transcript expression analysis by sleuth with scatter plot of read counts (counts per million)
Gene
Differential gene expression analysis by DESeq2 with scatter plot of read counts (counts per million)
Differential gene expression analysis by edgeR with scatter plot of read counts (counts per million)
Differential gene expression analysis by sleuth with scatter plot of read counts (counts per million)
GO
Differential GO expression analysis by DESeq2 with scatter plot of read counts (counts per million)
Differential GO expression analysis by edgeR with scatter plot of read counts (counts per million)


